
BMAT 2008 · Question 34 · Drawing Conclusions
SaveSection 1: Cycling level - facts According to the 2005 National Travel Survey (NTS) cycling is a relatively rare means of travel in the UK, and is declining. • Cycling accounts for 1% of all trips*, and 2% of trips of less than 2 miles, including those that are made on foot. • The average person makes 14 cycle trips per year and cycles a distance of 36 miles. • When asked how often they ride a bike, 15% of the population say at least once a week, and a further 8% say at least once a month. Over two thirds (69%) of people say they cycle less than once a year or never. • Those who do cycle average 5 trips a week by bicycle and travel 13 miles in a week. Cycling accounts for a fifth (22%) of all trips by cyclists† . * For the purposes of the survey a ‘trip’ is a one-way journey having a single main purpose – e.g. going to work. † A ‘cyclist’ is someone who cycles once a week or more.
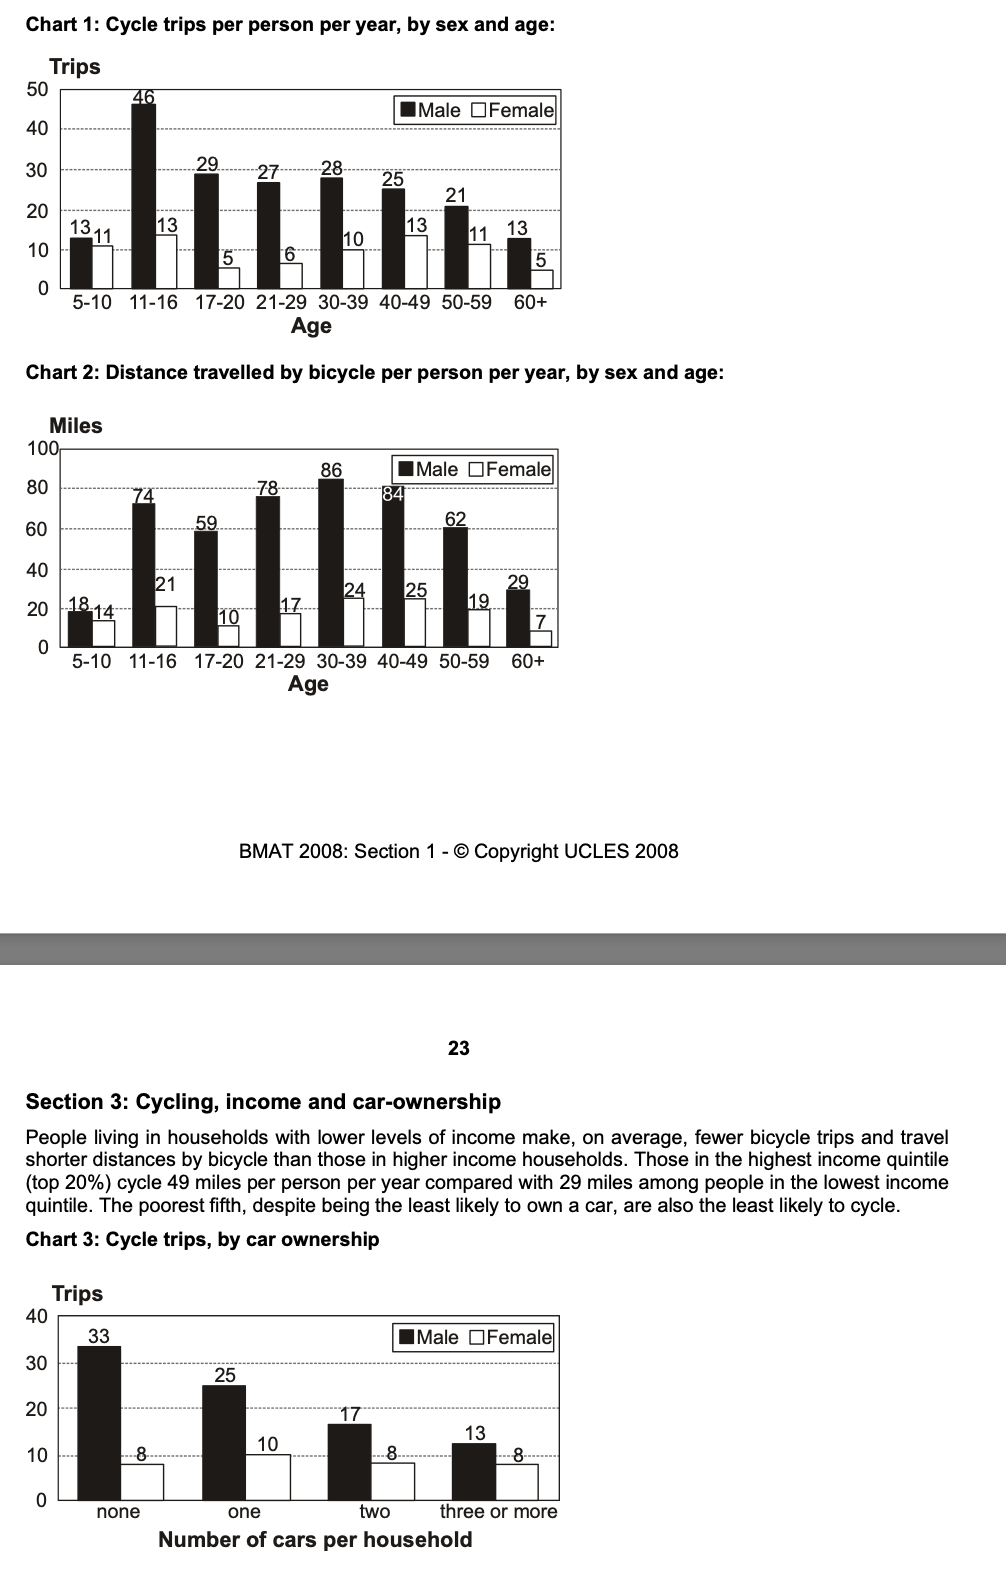
Referring to Section 3 "Those in the highest income quintile (top 20 %) cycle 49 miles per person per year compared with 29 miles among people in the lowest quintile." The relationship shown in Chart 3 between car ownership and cycling seems to contradict the data on cycling and income. Which of the following, if true, would adequately explain this seeming contradiction?