
BMAT 2009 · Question 25 · Logic
SaveThe table below summarises GCSE results for five schools in a town. A graph has been drawn which summarises this data but the graph has not yet been scaled or labelled.
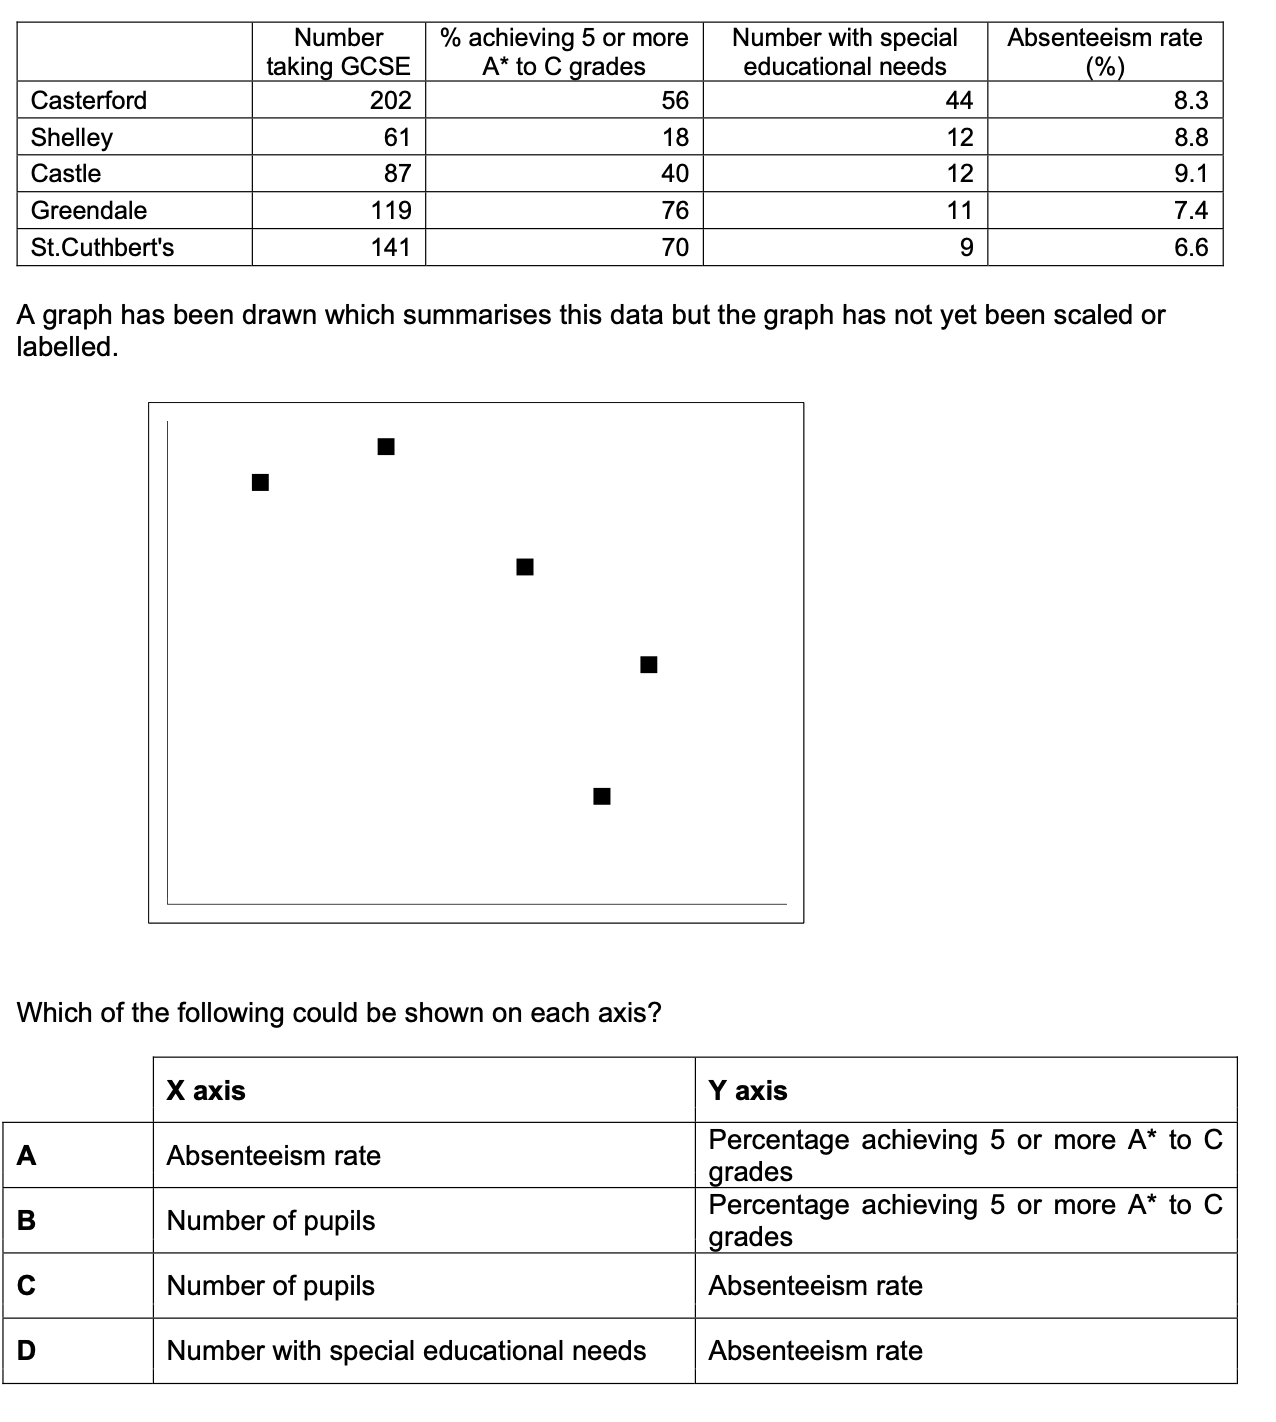
Which of the following could be shown on each axis?