
BMAT 2009 · Question 3 · Logic
SaveI recently asked four members of my class to draw bar charts of some data that we collected. Every student managed to produce a bar chart, but they all drew exactly two bars at the wrong height on their graph. I drew the correct bar chart from the data. Unfortunately, I didnít label any of the charts so I now donít know which one is the correct one.
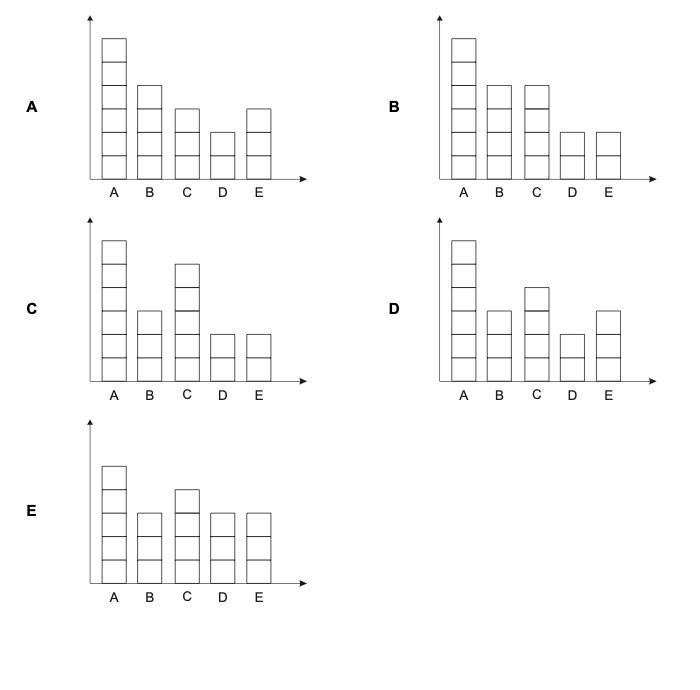
Which graph correctly represents the data that we collected? (All of the graphs are drawn to the same scale.)