
BMAT 2011 · Question 1 · Logic
SaveThe weather forecast for a five day period is summarised in the table below:
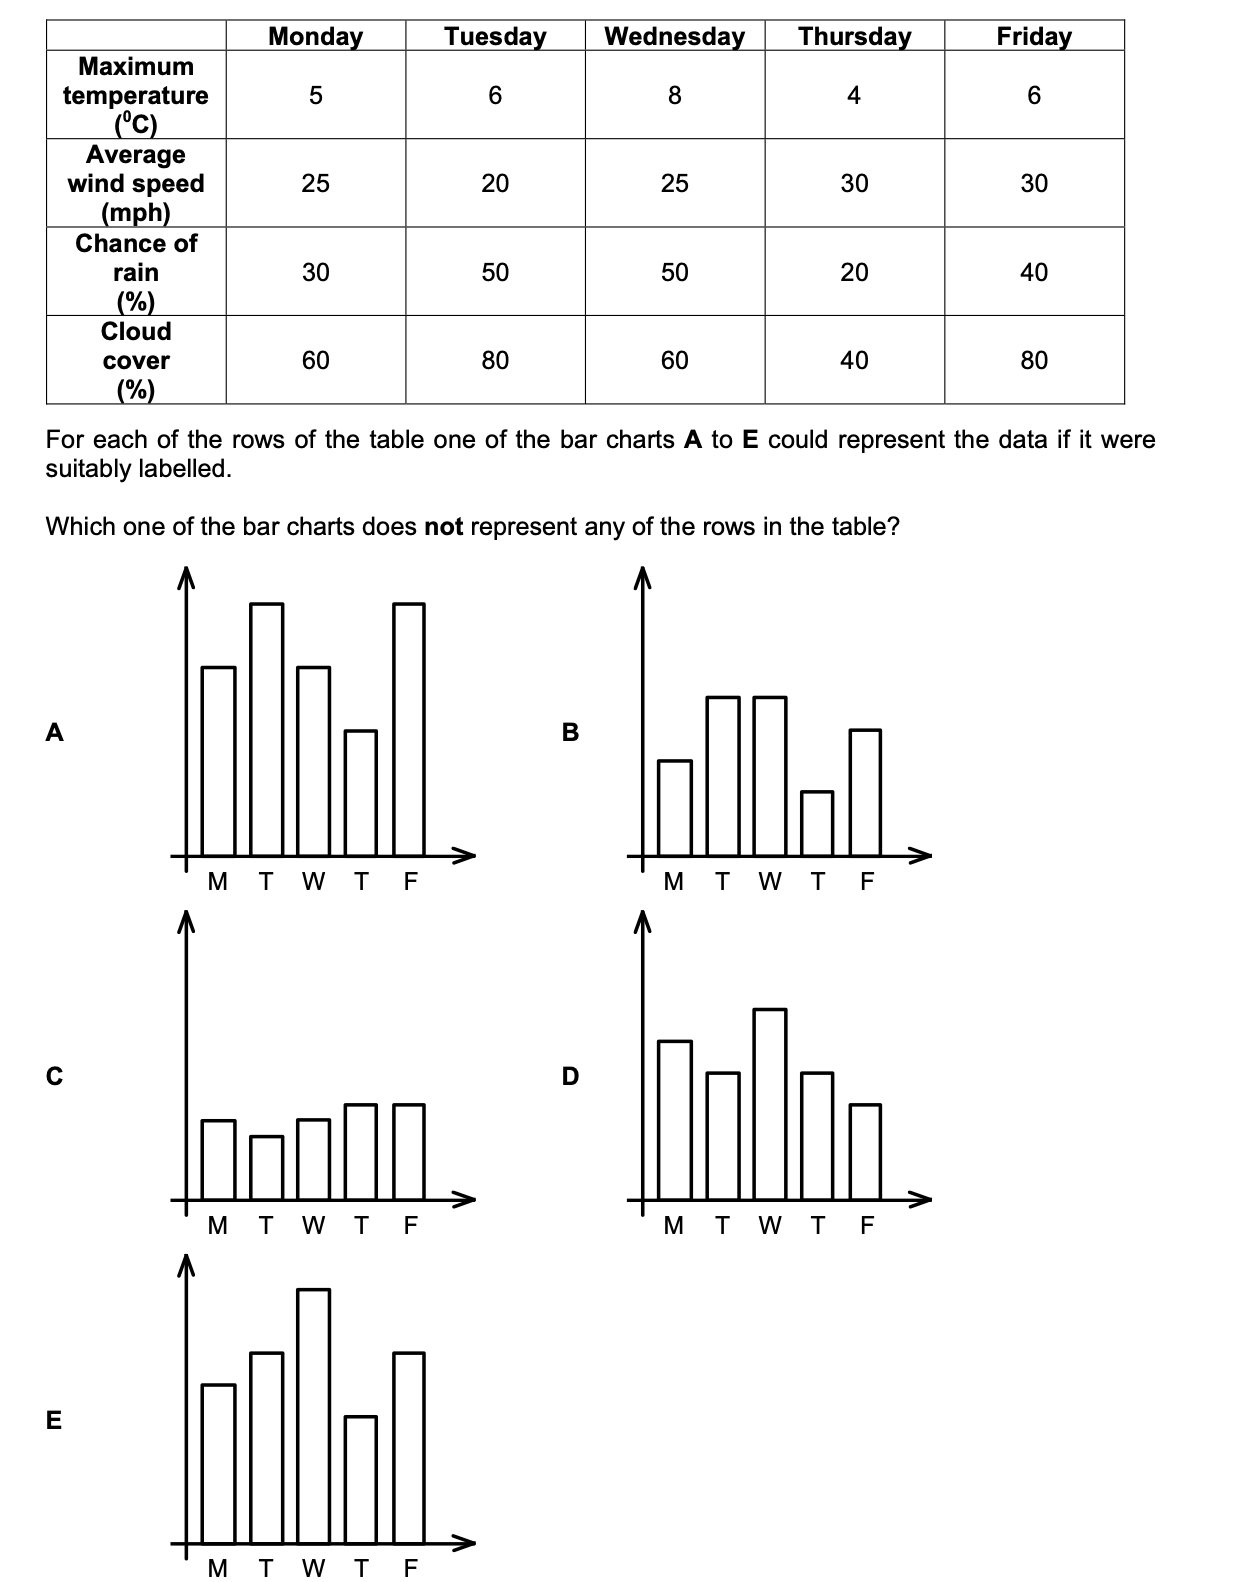
For each of the rows of the table one of the bar charts A to E could represent the data if it were suitably labelled. Which one of the bar charts does not represent any of the rows in the table?