
BMAT 2011 · Question 21 · Drawing Conclusions
SaveTree diagrams are used in decision making by predicting the various possible outcomes and their likelihood. The diagram below represents the choices facing an oil company - call it 'X-Oil' - who have discovered a possible oil deposit and are deciding whether or not to drill at the site. They will make the decision on purely financial terms - i.e. likely profits or losses. The key factors are the known drilling costs (80,000, would mean a net loss of $720,000 when drilling costs are factored in. But there is only a small chance of this, 0.1 or 10%. There is an equally small (10%) chance of a big and very profitable strike, approaching $5 million. The most likely outcome is a medium strike. If the company decides not to drill, there is a 20% chance of finding a buyer for the drilling rights at 500,000. To assist the decision whether to drill or not, each of the possible outcomes is assessed by multiplying the chance (probability) of each outcome by the potential profit or loss. If the sum of the possible outcomes (profit x chance) of a decision to drill is greater than the sum of outcomes of a decision not to drill, statistically the better option is to drill.
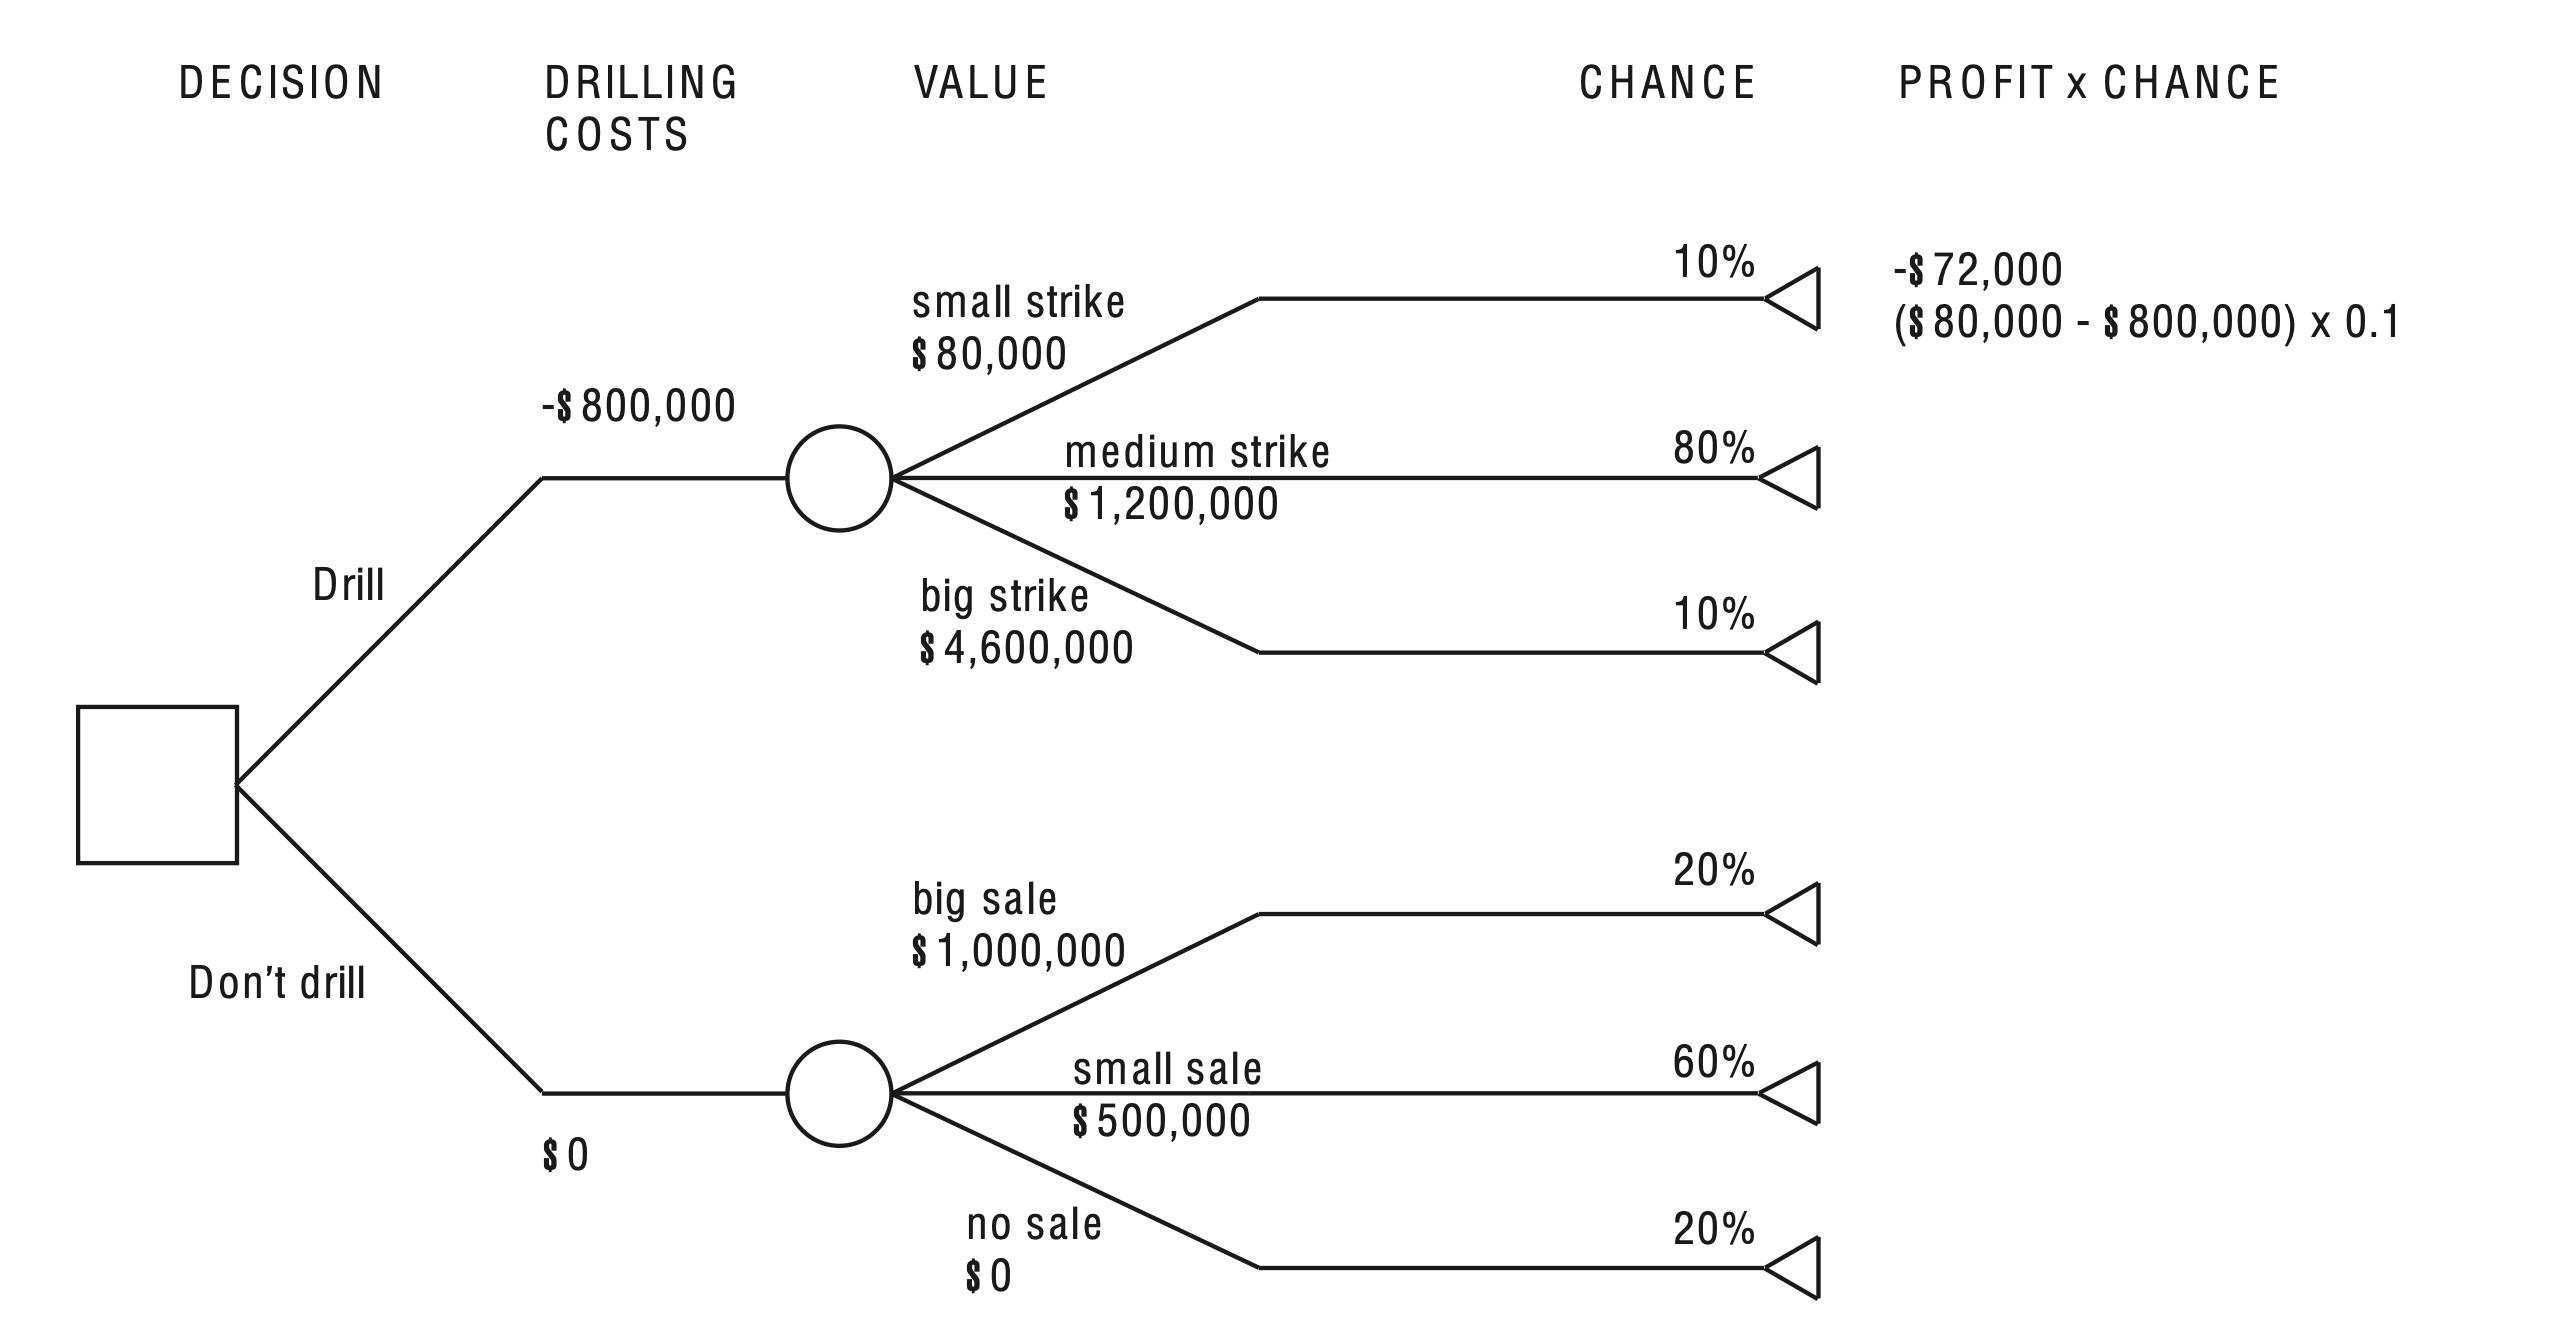
For a company (Y-Oil) that bought the drilling rights for $500,000 and proceeded to drill for oil, which of the following statements are true? 1 Given the estimated costs, Y-Oil would not make a profit if there was only a 'medium' strike. 2 Given the estimated costs, the chances of Y-Oil making a profit are less than 80%. 3 Y-Oil could make a profit from a 'medium' strike if they could reduce drilling costs by 25%.