
BMAT 2011 · Question 22 · Logic
SaveTree diagrams are used in decision making by predicting the various possible outcomes and their likelihood. The diagram below represents the choices facing an oil company - call it 'X-Oil' - who have discovered a possible oil deposit and are deciding whether or not to drill at the site. They will make the decision on purely financial terms - i.e. likely profits or losses. The key factors are the known drilling costs (80,000, would mean a net loss of $720,000 when drilling costs are factored in. But there is only a small chance of this, 0.1 or 10%. There is an equally small (10%) chance of a big and very profitable strike, approaching $5 million. The most likely outcome is a medium strike. If the company decides not to drill, there is a 20% chance of finding a buyer for the drilling rights at 500,000. To assist the decision whether to drill or not, each of the possible outcomes is assessed by multiplying the chance (probability) of each outcome by the potential profit or loss. If the sum of the possible outcomes (profit x chance) of a decision to drill is greater than the sum of outcomes of a decision not to drill, statistically the better option is to drill.
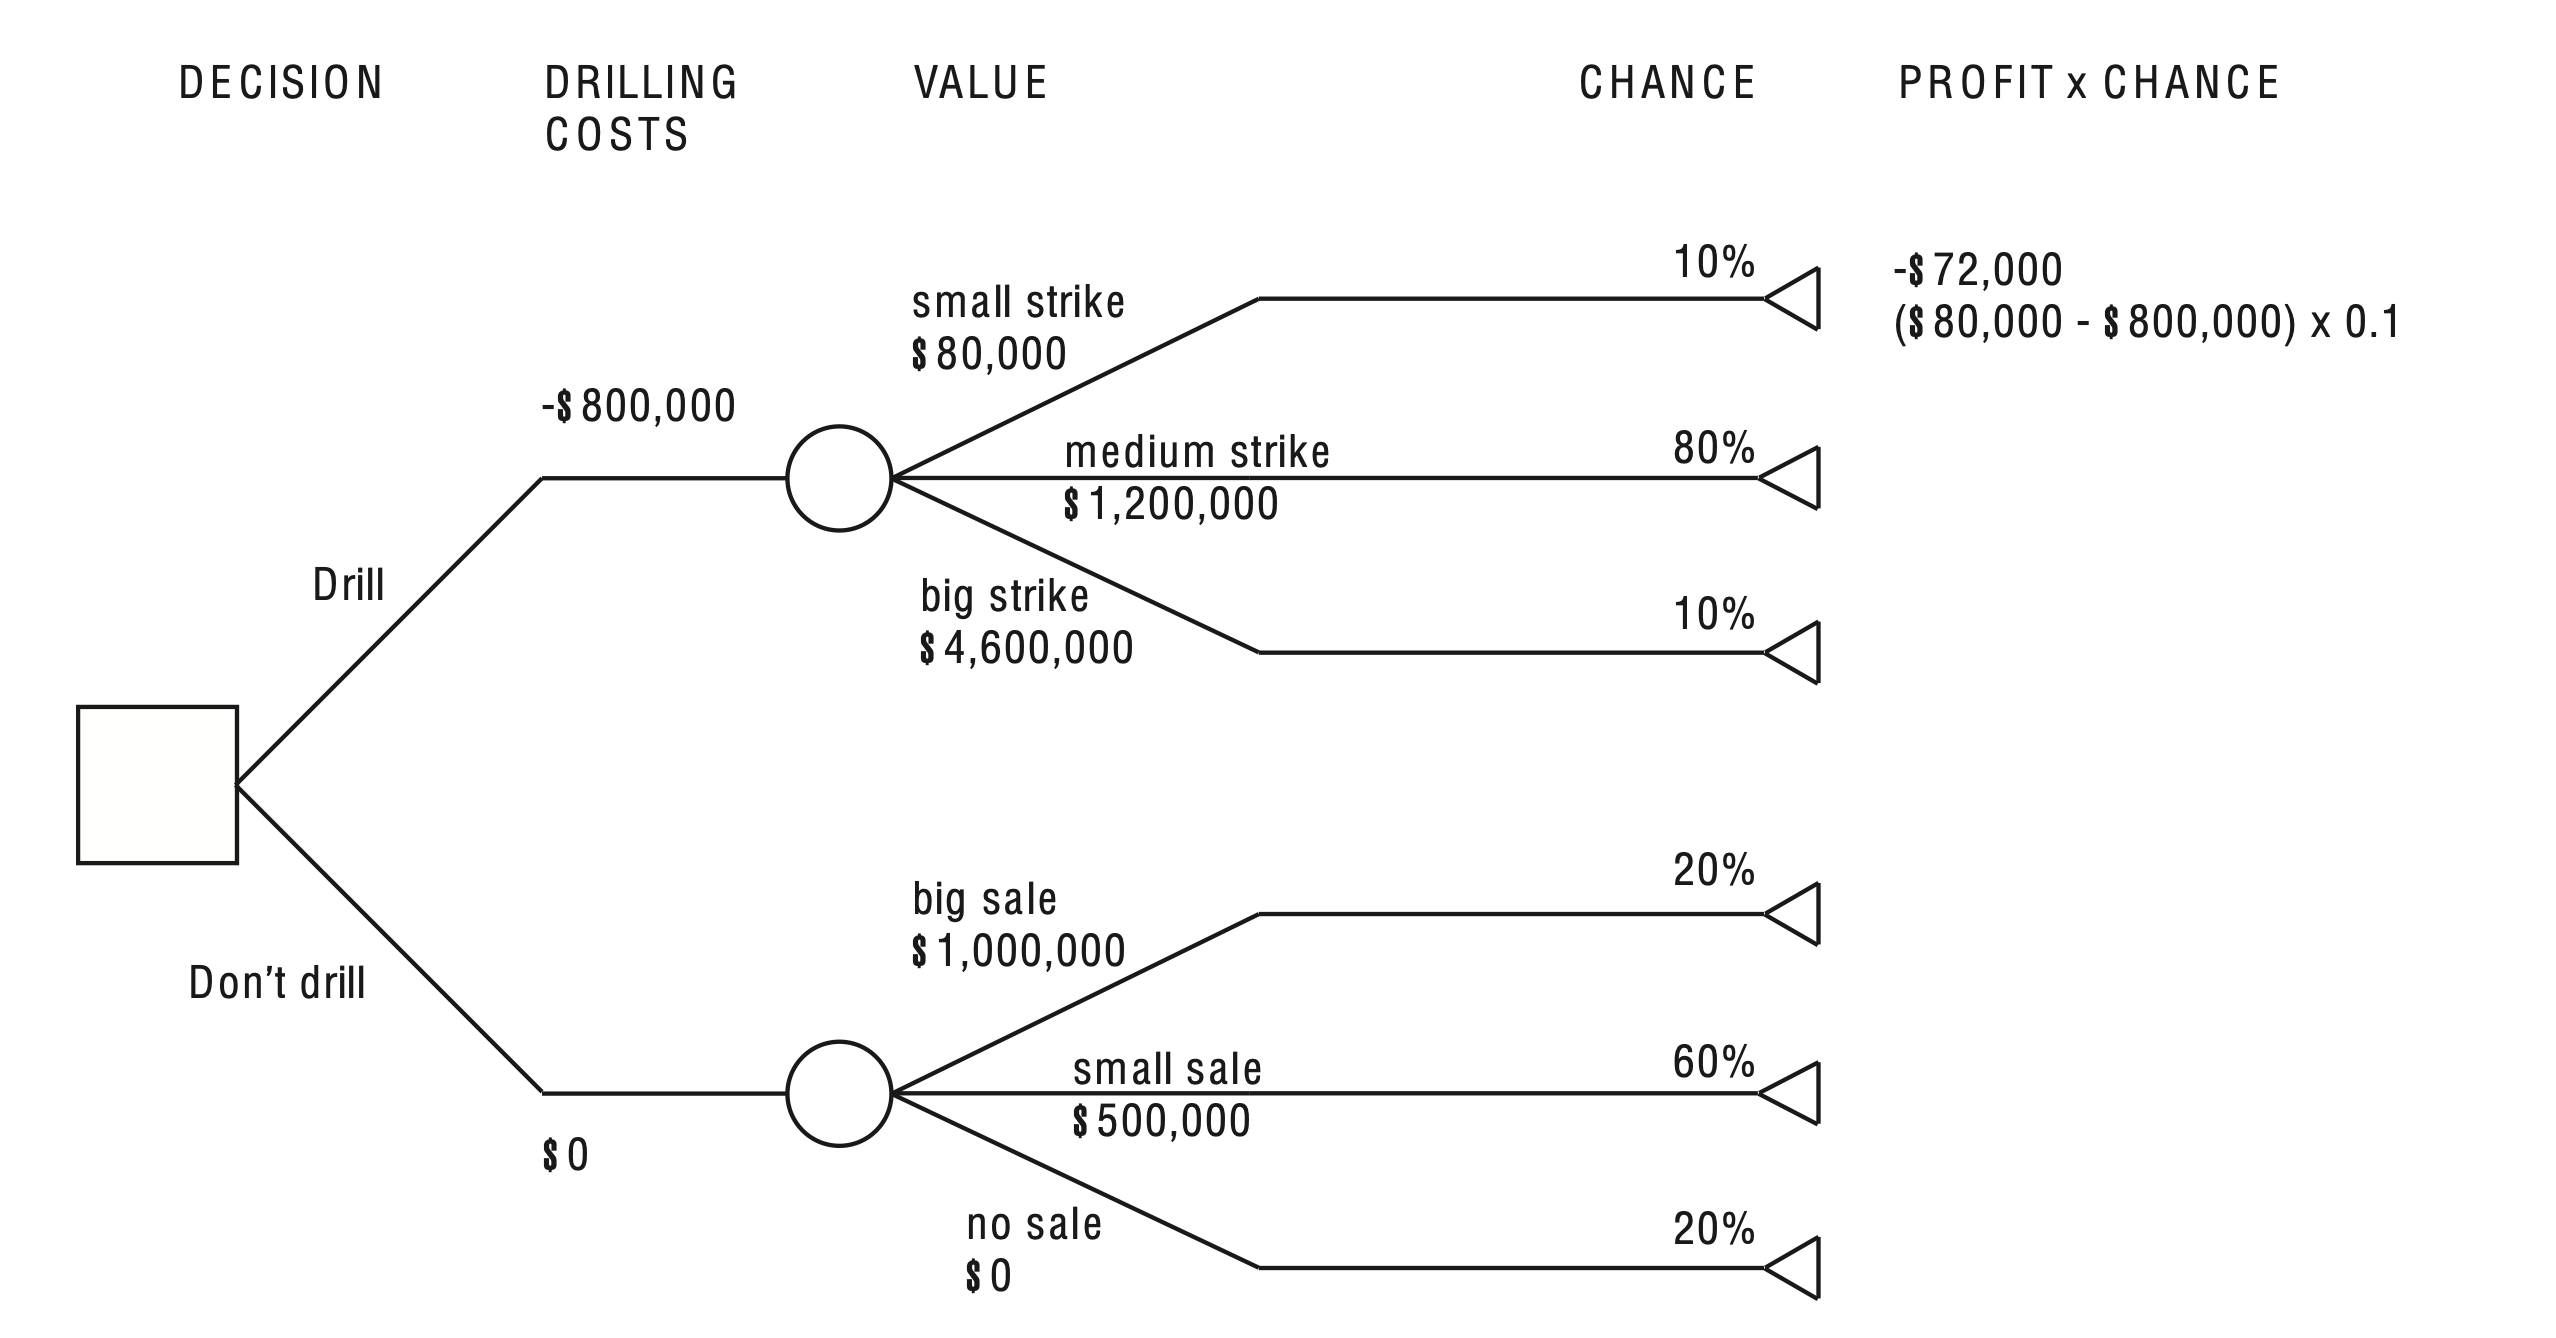
Health and Safety advisors have warned that an accidental oil-spill at the site during drilling, resulting in compensation of up to $10,000,000, has a probability of 0.03 of occurring during a drill of the kind proposed. Insurance premiums against such an incident would cost the company $200,000. Using the above information and assuming the data given in the tree diagram remains the same, place the following options in the most favourable order: X-Oil should: 1 pay the insurance and proceed with the drilling. 2 proceed with the drilling without insurance. 3 decide against drilling.