
BMAT 2011 · Question 34 · Logic
SaveThe graph below shows the results of surveys of local medical practices on number of patient consultations in 1995 and 2006. Consultations include face-to-face meetings with both doctors and nurses, telephone consultations and home visits. The overall mean consultation rate (per patient per year) was 3.90 in 1995 and 5.26 in 2006. Findings for all years in the survey are shown below The consultation rate for doctors remained almost constant over the study period with 3.0 consultations per patient-year in 1995 and 3.3 in 2006. The consultation rate for nurses increased from 0.8 consultations per patient-year in 1995 to 1.8 in 2006. The consultation rate for other clinicians increased from 0.1 consultations per patient-year in 1995 to 0.2 in 2006.
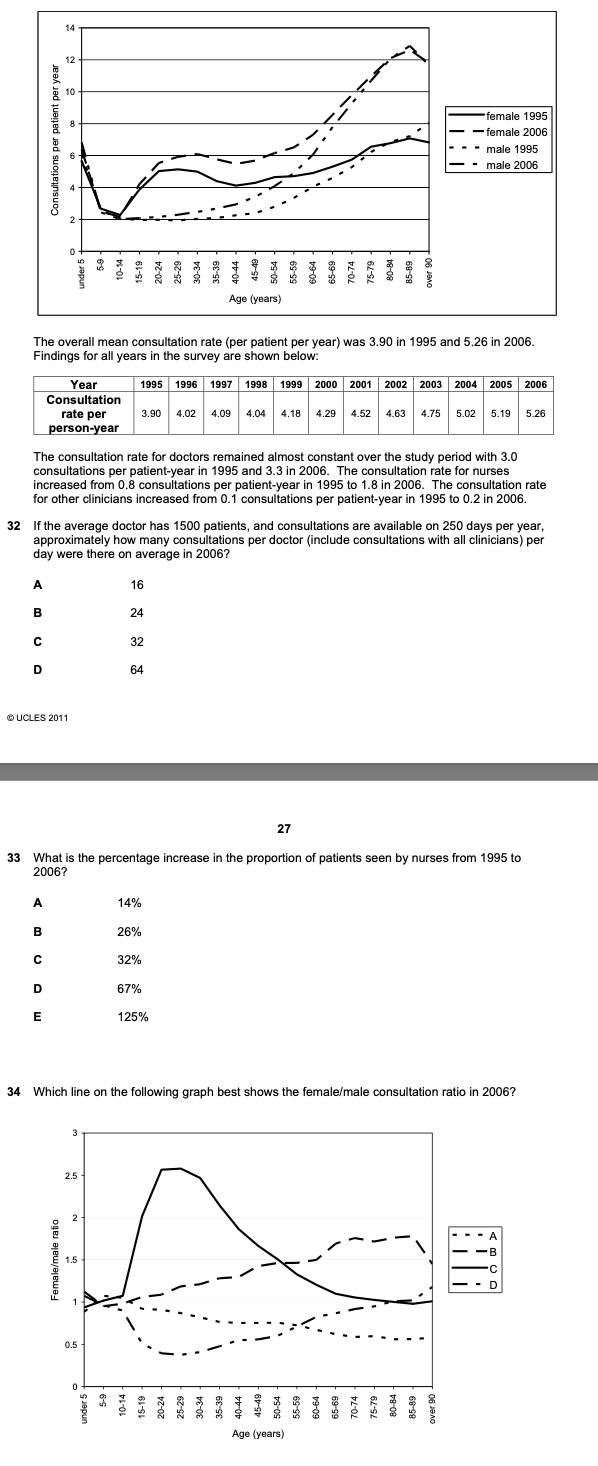
Which line on the following graph best shows the female/male consultation ratio in 2006?