
BMAT 2014 · Question 1 · Logic
SaveThe table below shows ‘audience numbers’ and ‘time per visit’ for a number of popular social networking sites. A comparison of figures for the month of February is shown for two consecutive years.
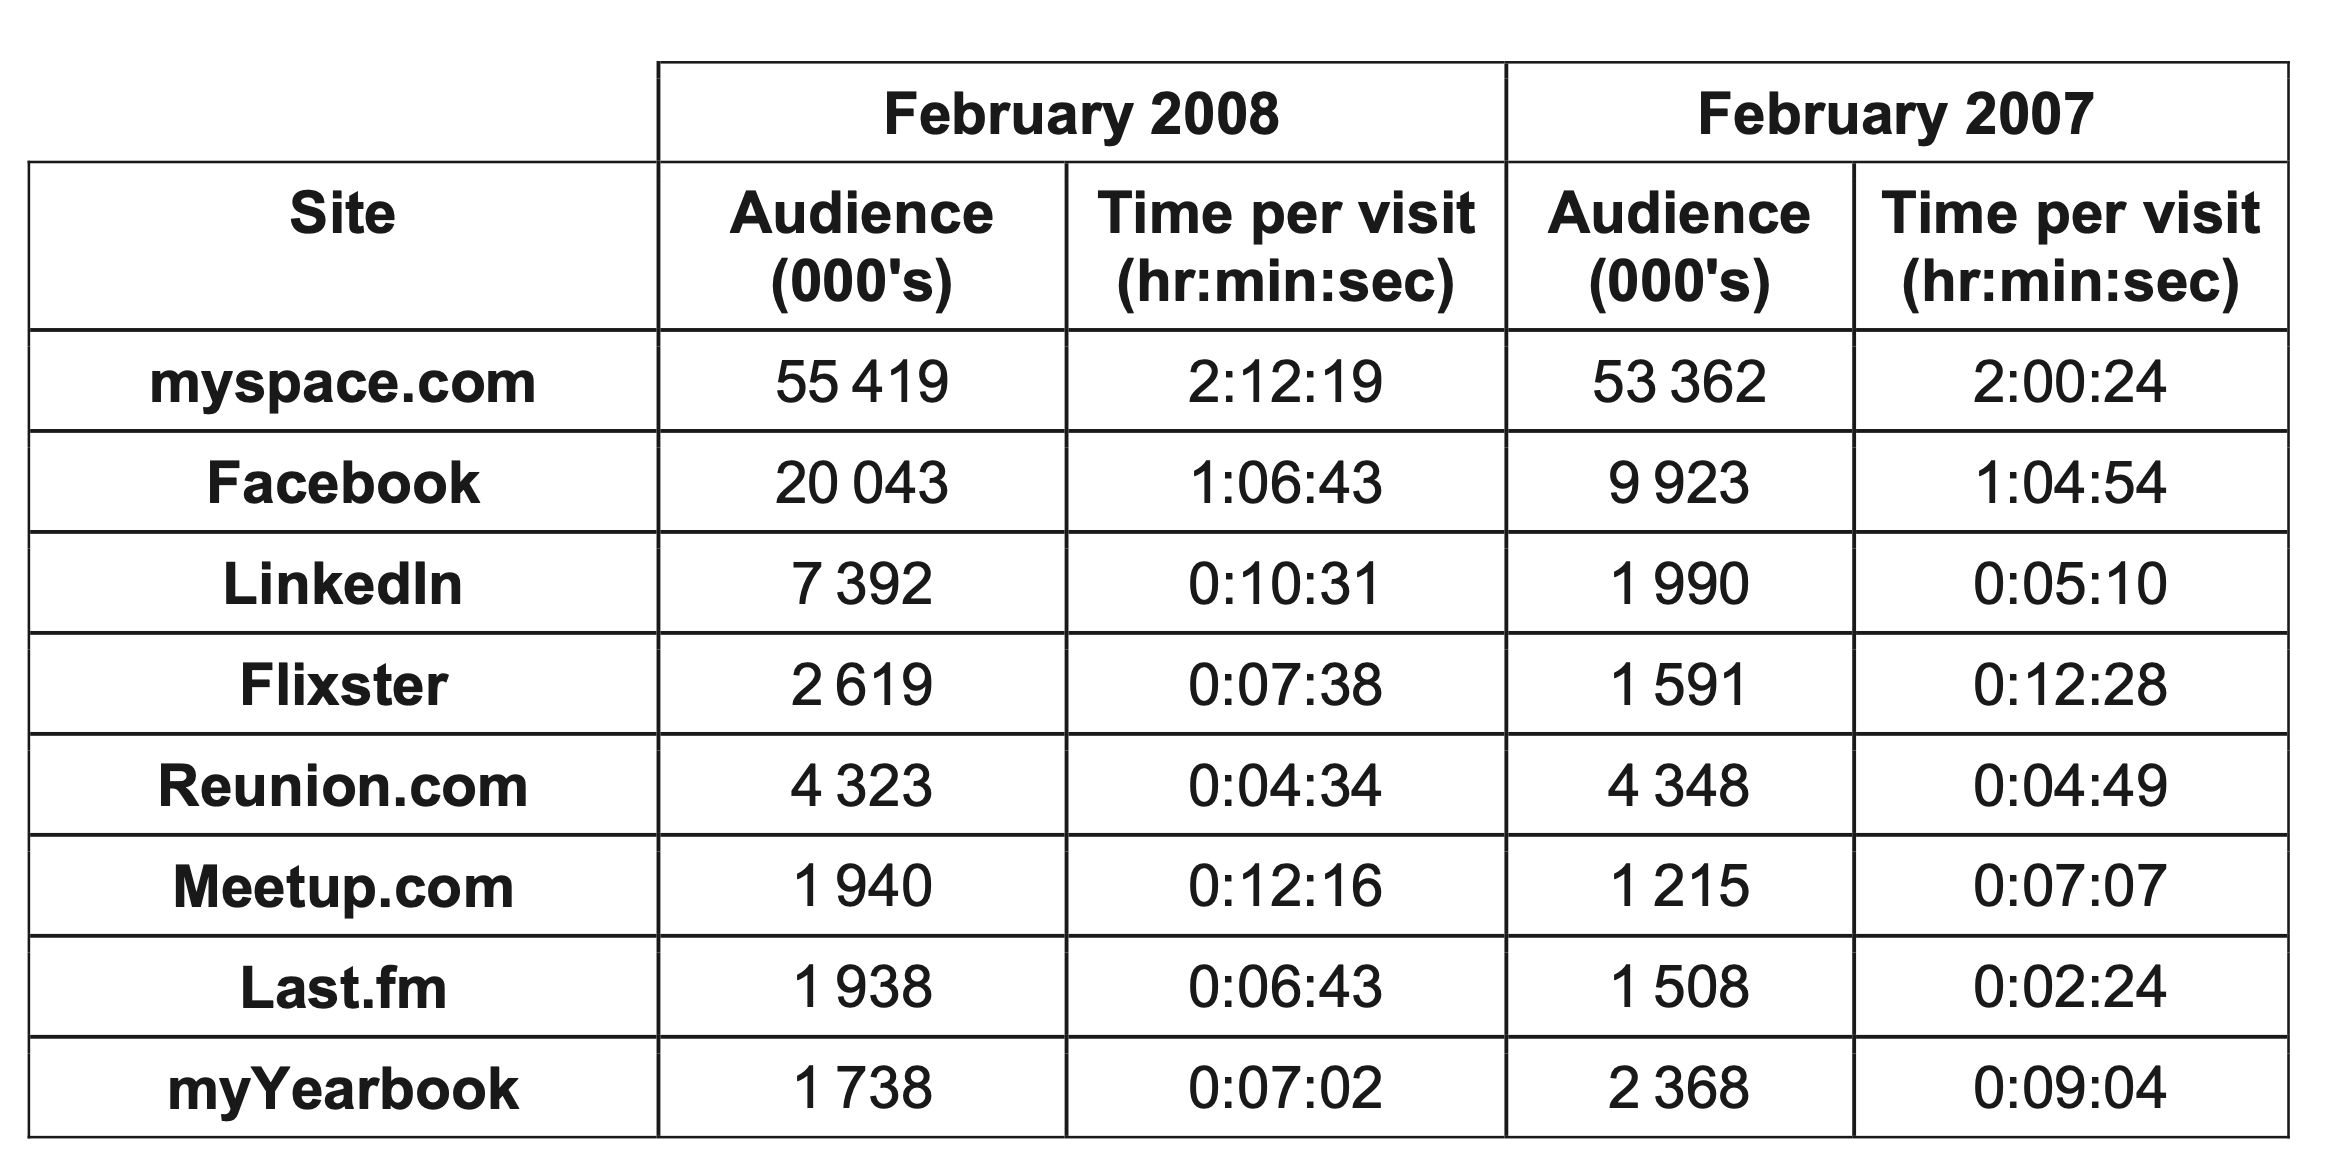
How many sites had an increase in both 'audience numbers' and 'time per visit' from 2007 to 2008?