
BMAT 2018 · Question 5 · Ratio/Proportion/Percentage
SaveThe table shows the average usage, in minutes per day, of five different mobile phone functions, for each of five friends.
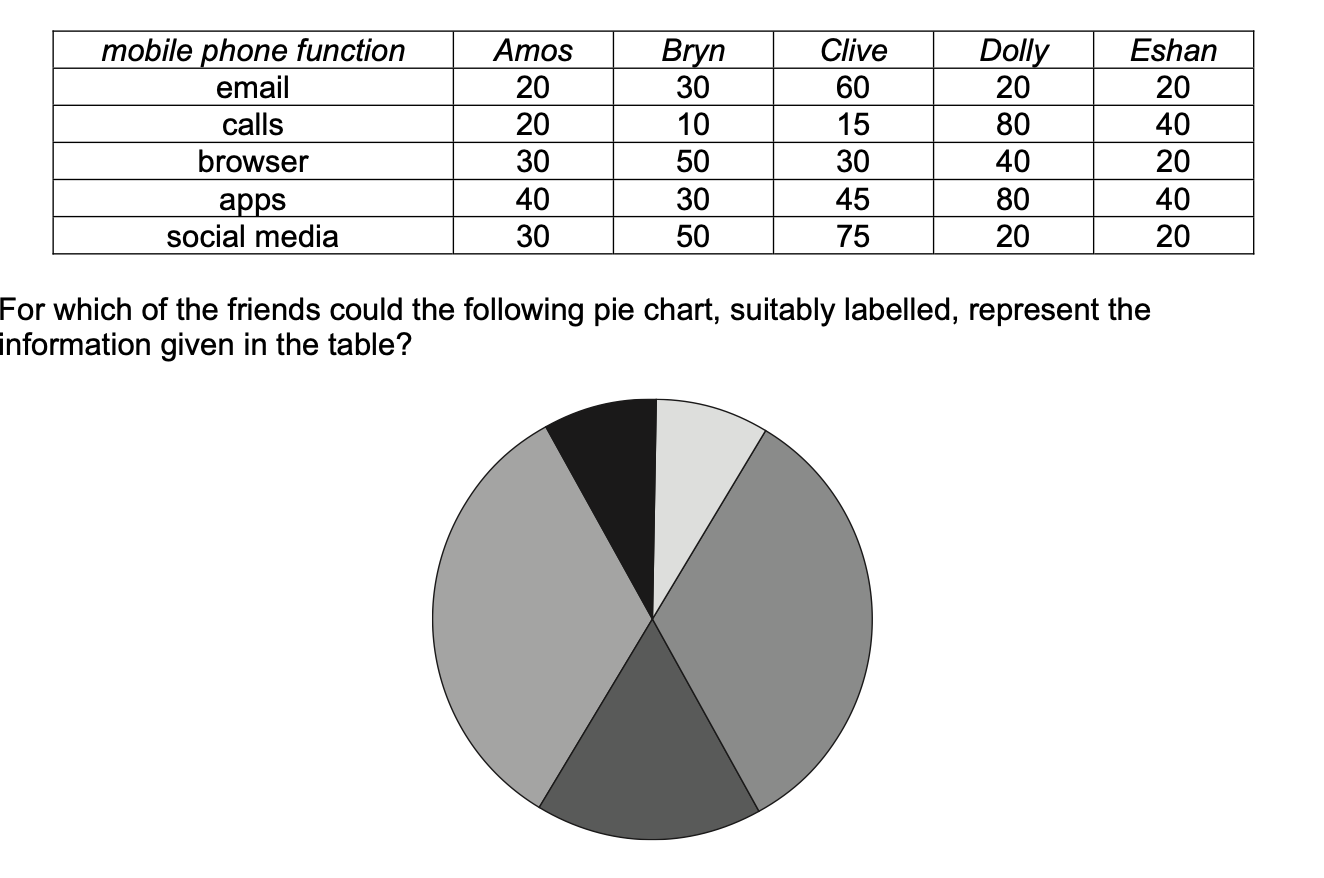
For which of the friends could the following pie chart, suitably labelled, represent the information given in the table?