
TSA 2009 · Question 38 · Ratio/Proportion/Percentage
SaveThe graph below shows Northern Ireland house prices as a percentage of the UK average (1980=100%) for the period 1980 to 1986.
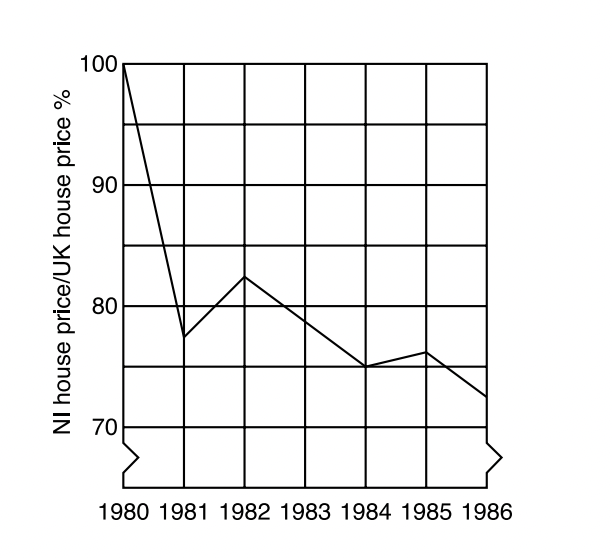
Which one of the following pieces of information can be inferred from the graph above?