
TSA 2009 · Question 7 · Ratio/Proportion/Percentage
SaveThe following table gives figures for the percentage growth per year of labour productivity per person per year in various countries during three periods.
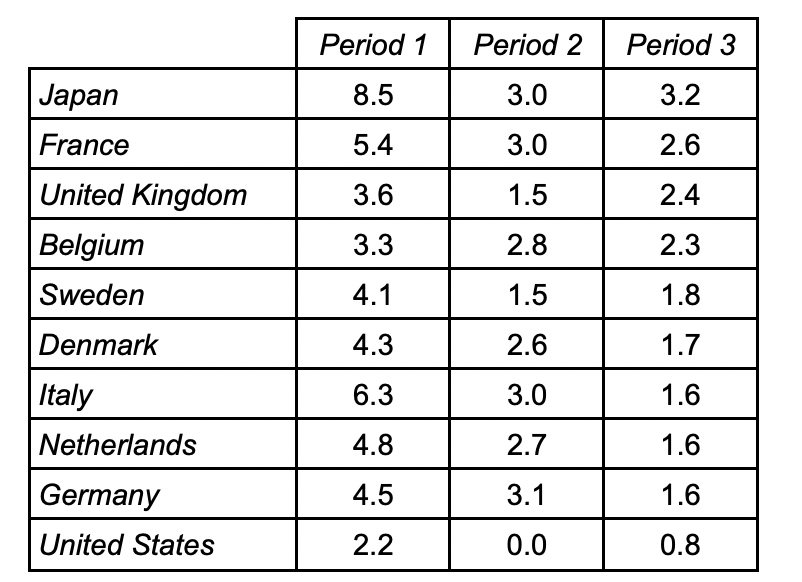
Which country's percentage growth per year remained consistently greater than half of its Period 1 level throughout the following periods?