
TSA 2014 · Question 26 · Best Fit
SaveThe bar chart shows the amount of money in the savings accounts of three friends at the start of the year. [image of account balance] Since then, they have all spent the same amount of money from their accounts and the amount in Belinda's account has halved.
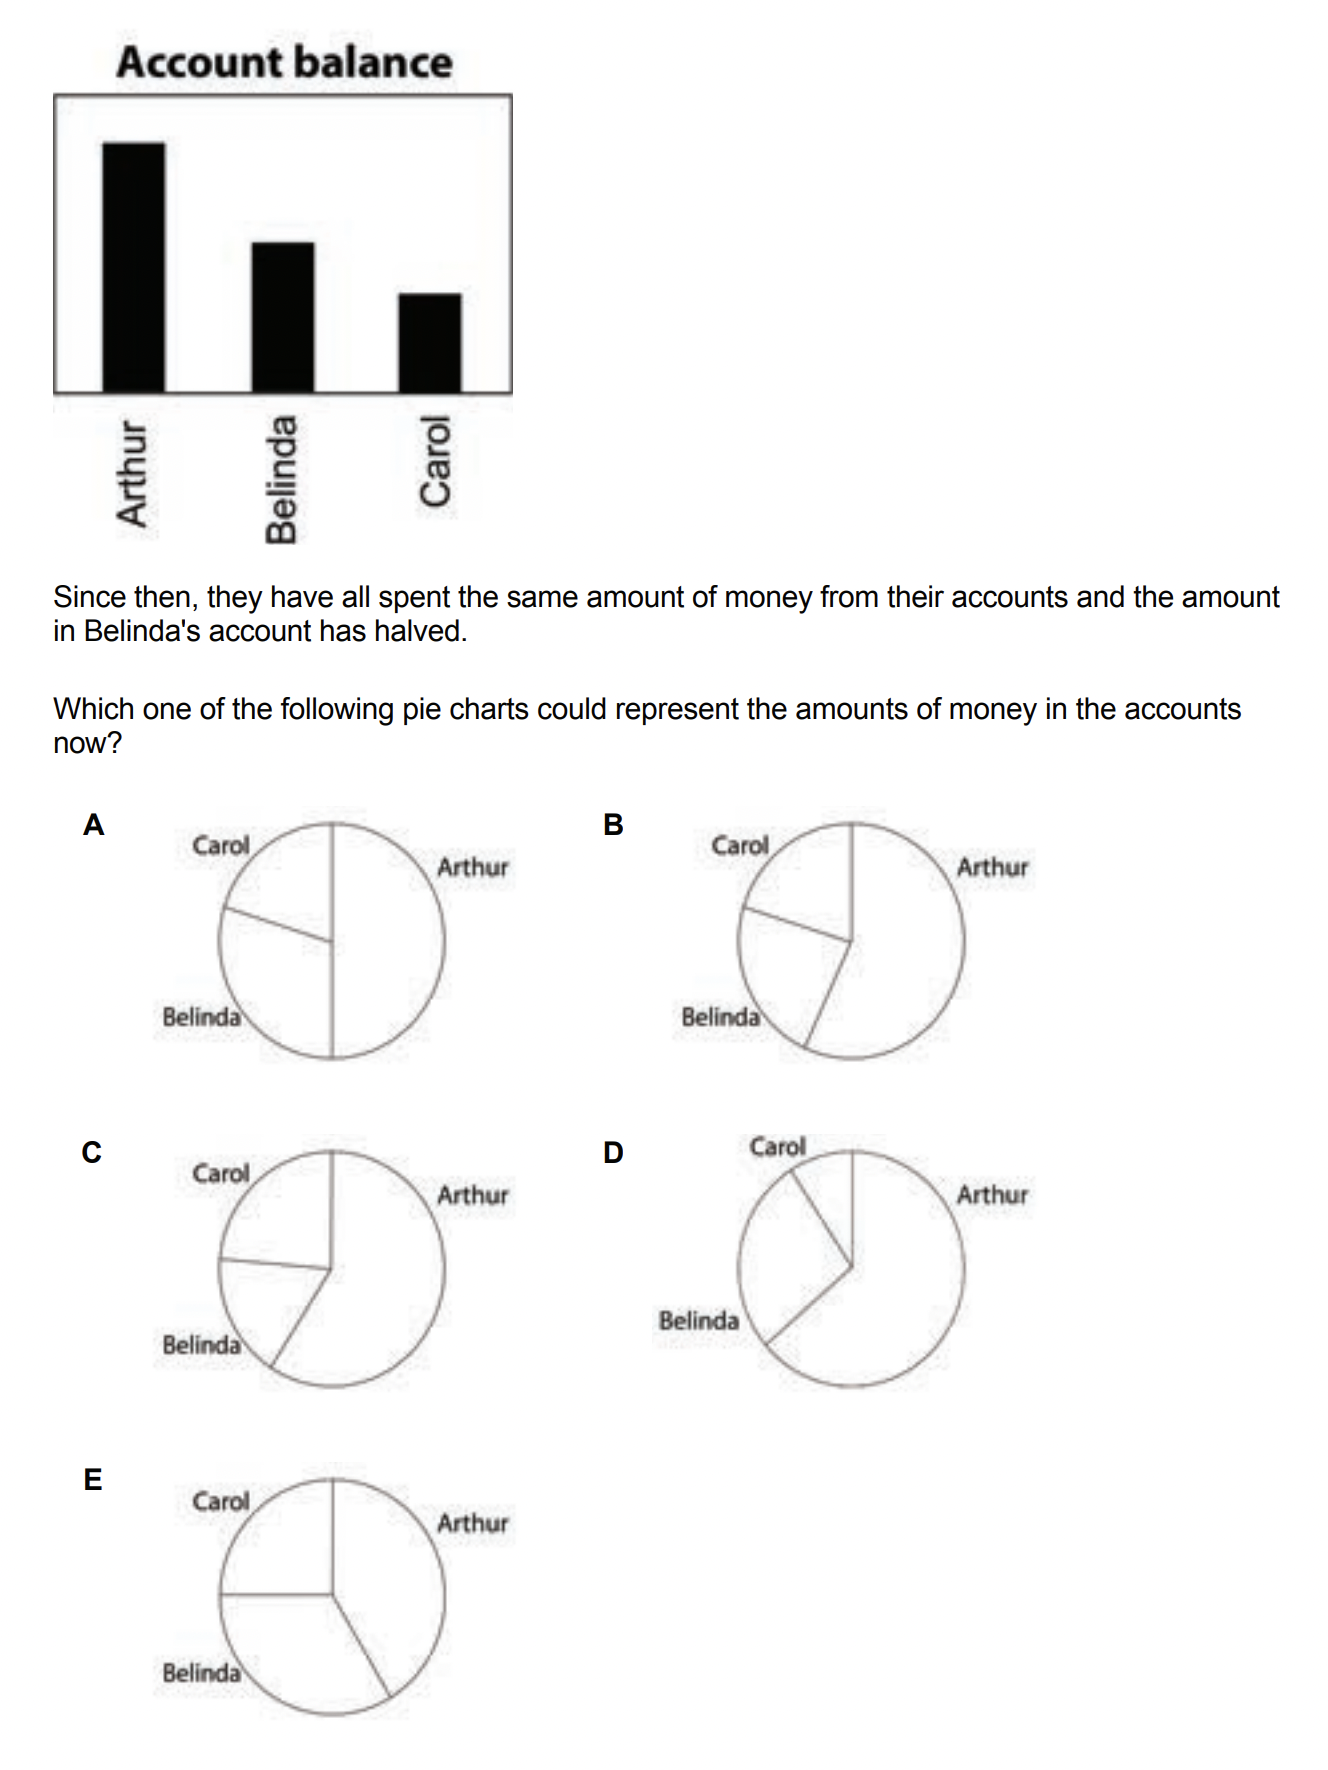
Which one of the following pie charts could represent the amounts of money in the accounts now?