
TSA 2015 · Question 20 · Logic
SaveThe maths sets at Newtown Comprehensive are identified by their teacher's name. Every year the Head of Maths gives the same test to all the maths sets at the end of year 7, calculates the average mark for each set and then produces the results on a bar chart in ascending order. He is asked to present the graphs for the last five years to the Board of Governors. Unfortunately, when they were cut and pasted onto one sheet by the Clerk to the Governors, the years were missed off. The results for last year were as follows:
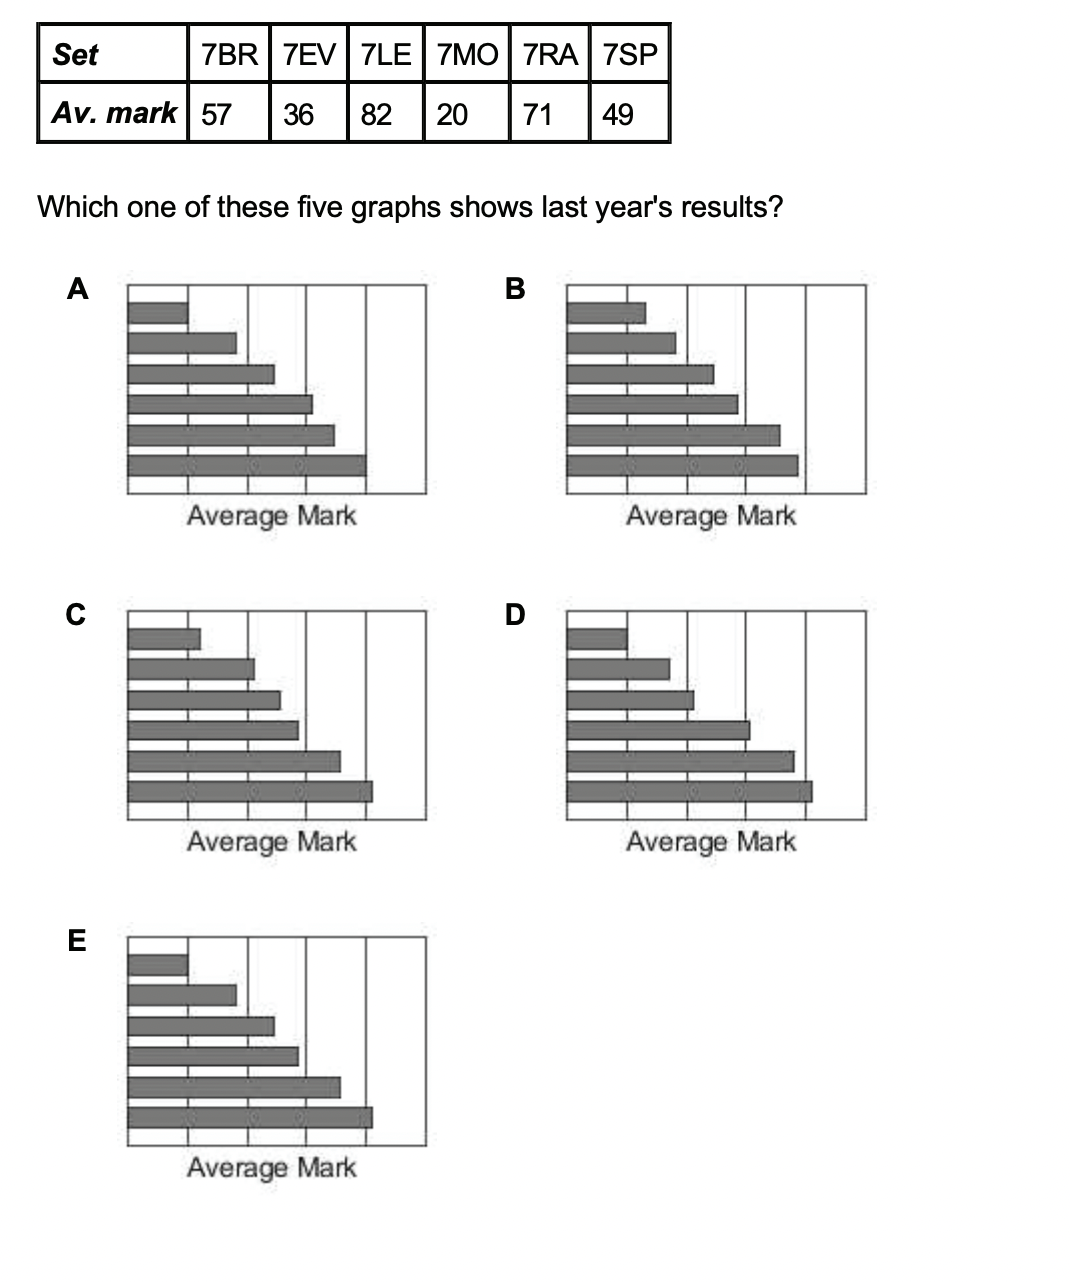
Which one of these five graphs shows last year's results?