
TSA 2016 · Question 32 · Rates
SaveWater was poured into five containers at a steady rate until each was full. A graph of the depth of water (h) in the container against time (t) was sketched for each container. One of the graphs has been lost.
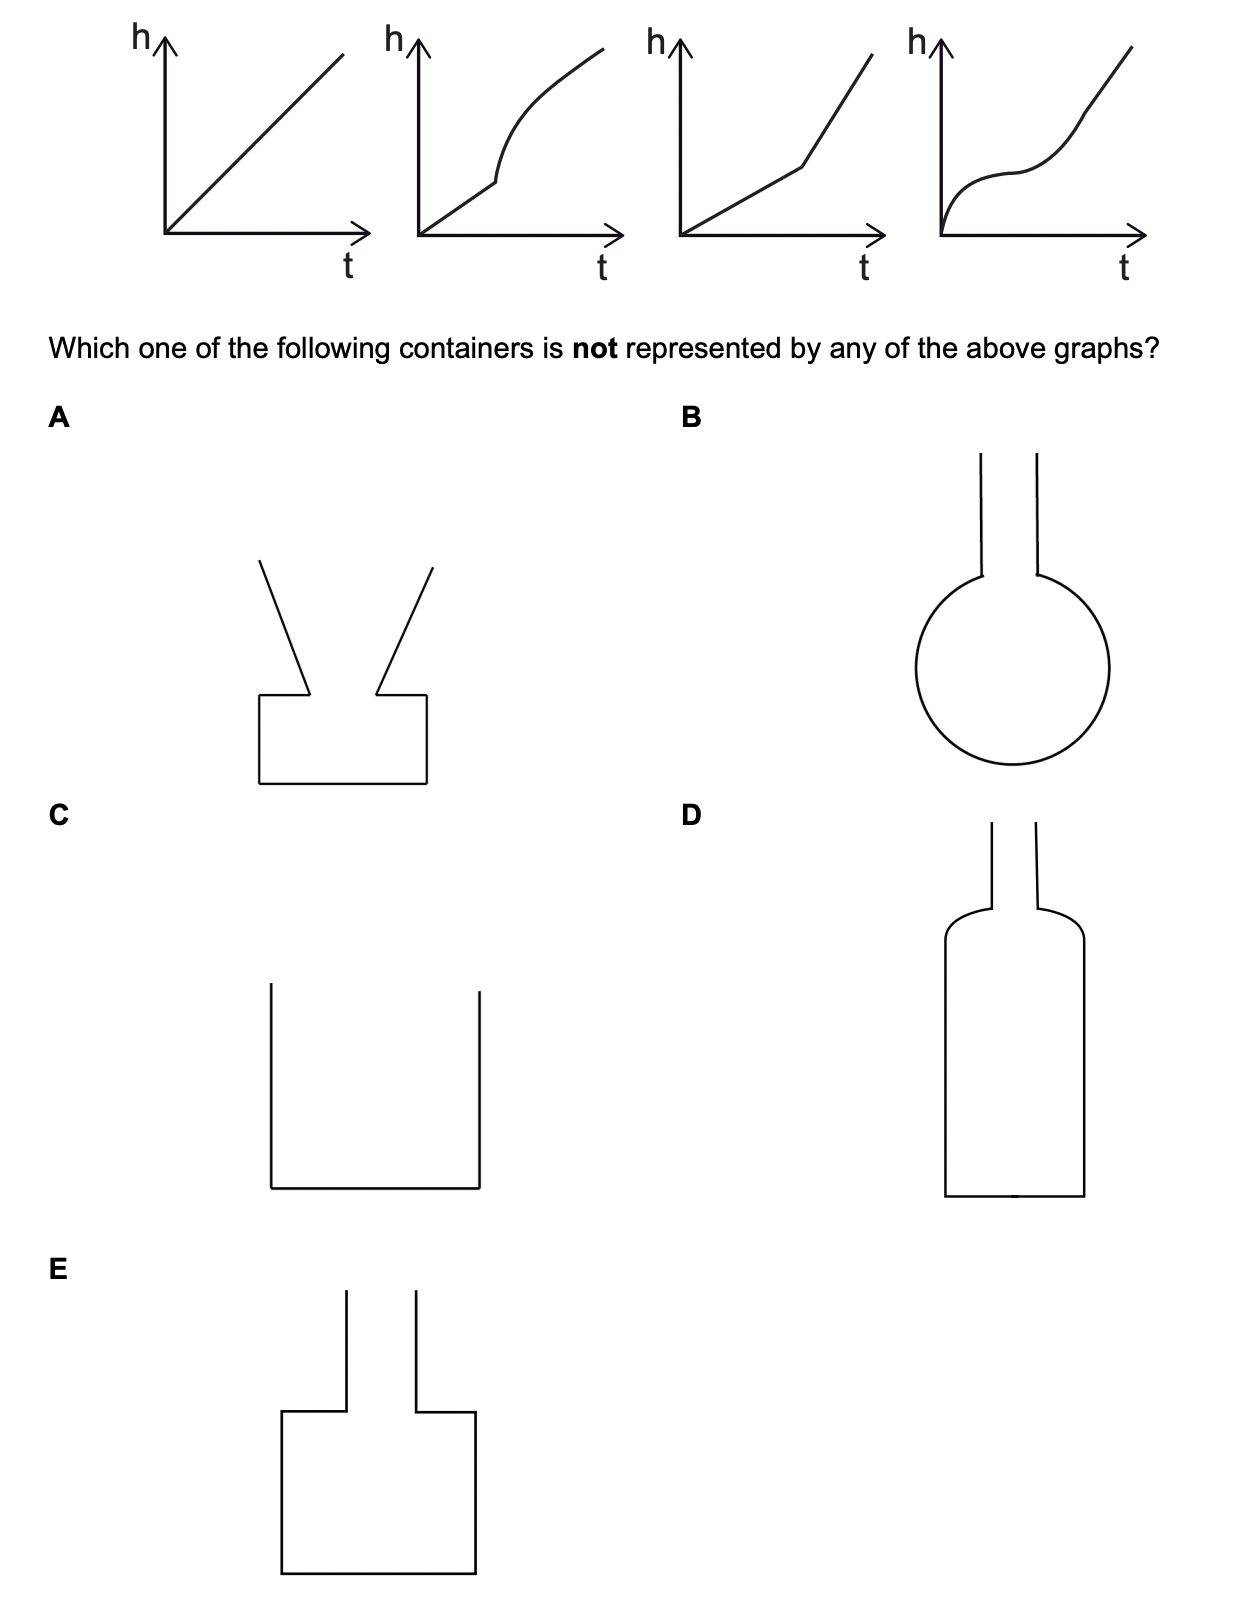
Which one of the following containers is not represented by any of the above graphs?