
TSA 2017 · Question 20 · Ratio/Proportion/Percentage
SaveAfter the financial crash there were fewer new car registrations in the UK in 2012 than there were in 2007. The monthly figures for new car registrations for both years are given in the table below.
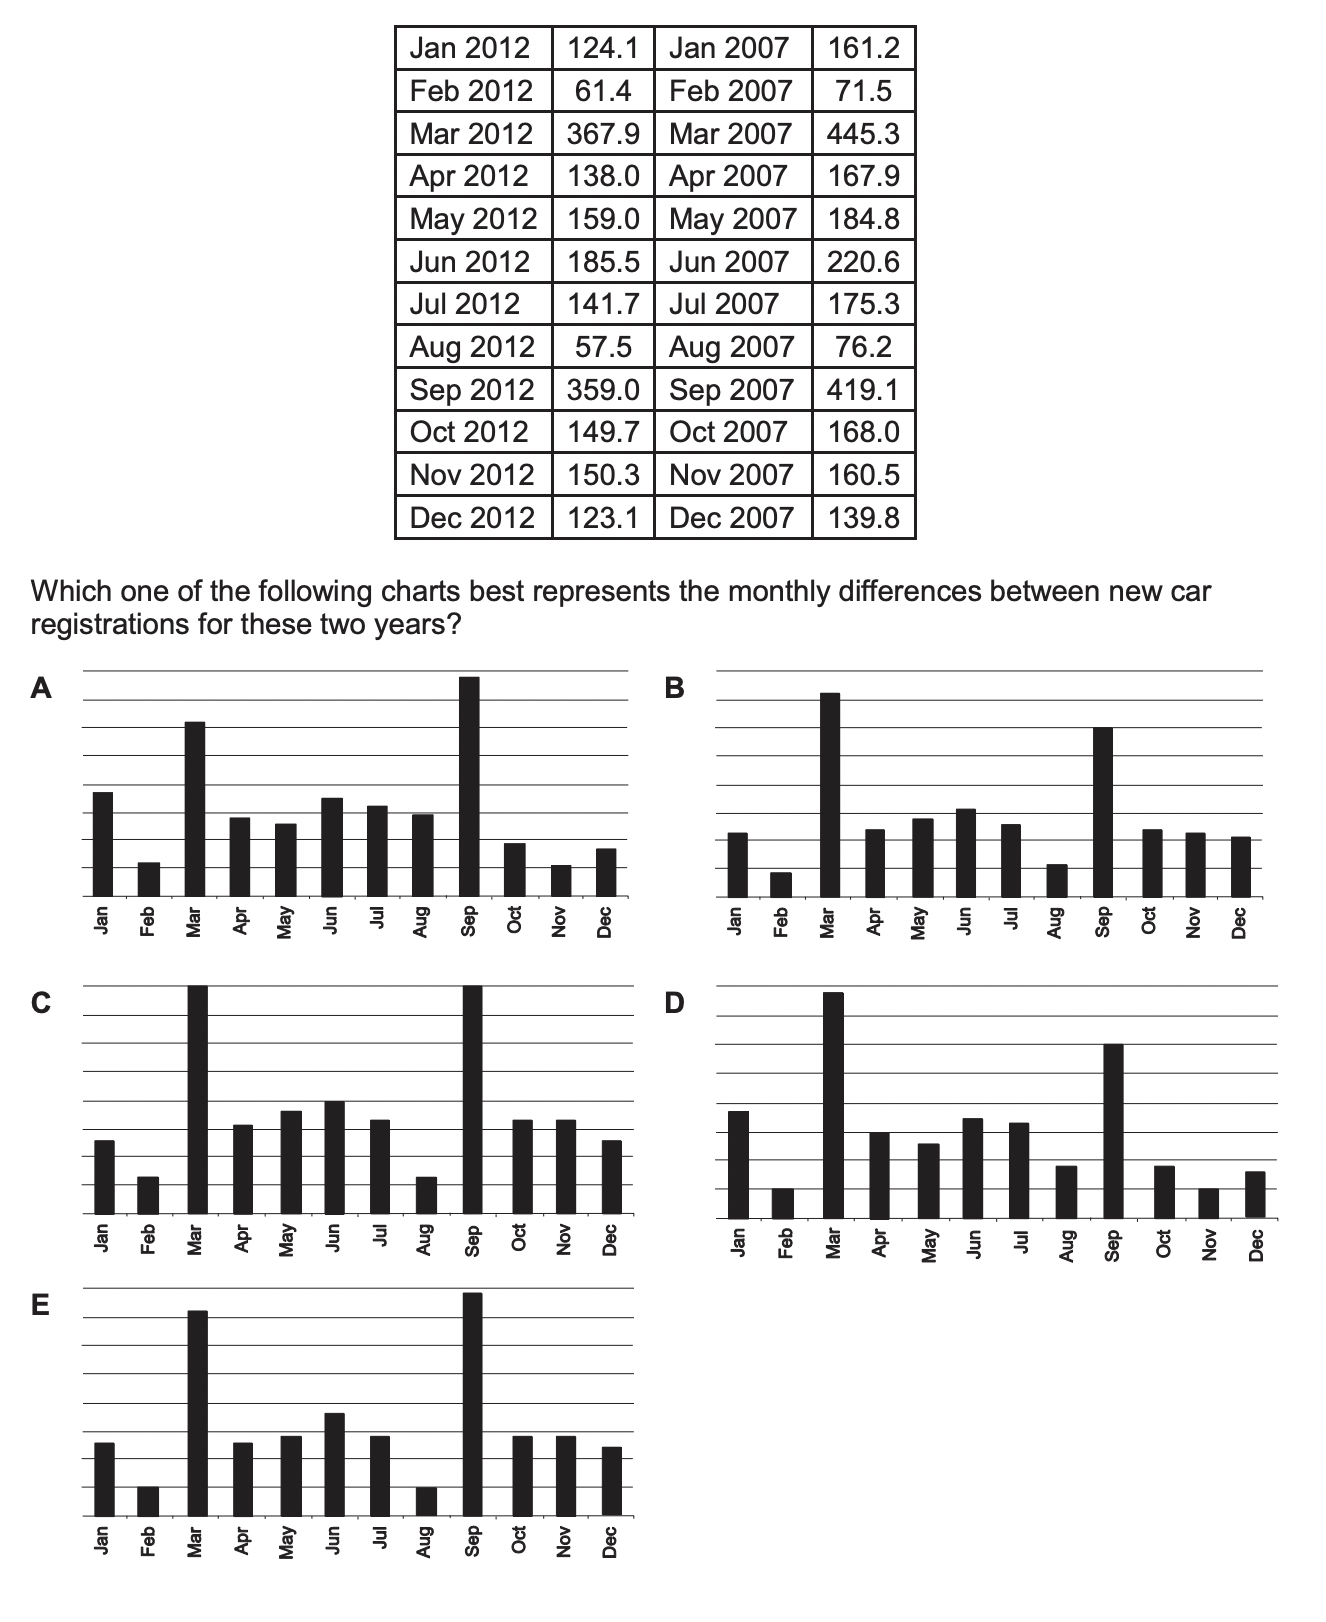
Which one of the following charts best represents the monthly differences between new car registrations for these two years?