
TSA 2019 · Question 38 · Logic
SaveThe Head of Year 6 is planning an end-of-term treat for her students. The pie chart represents the numbers of votes cast by the children for each of the five possible outings.
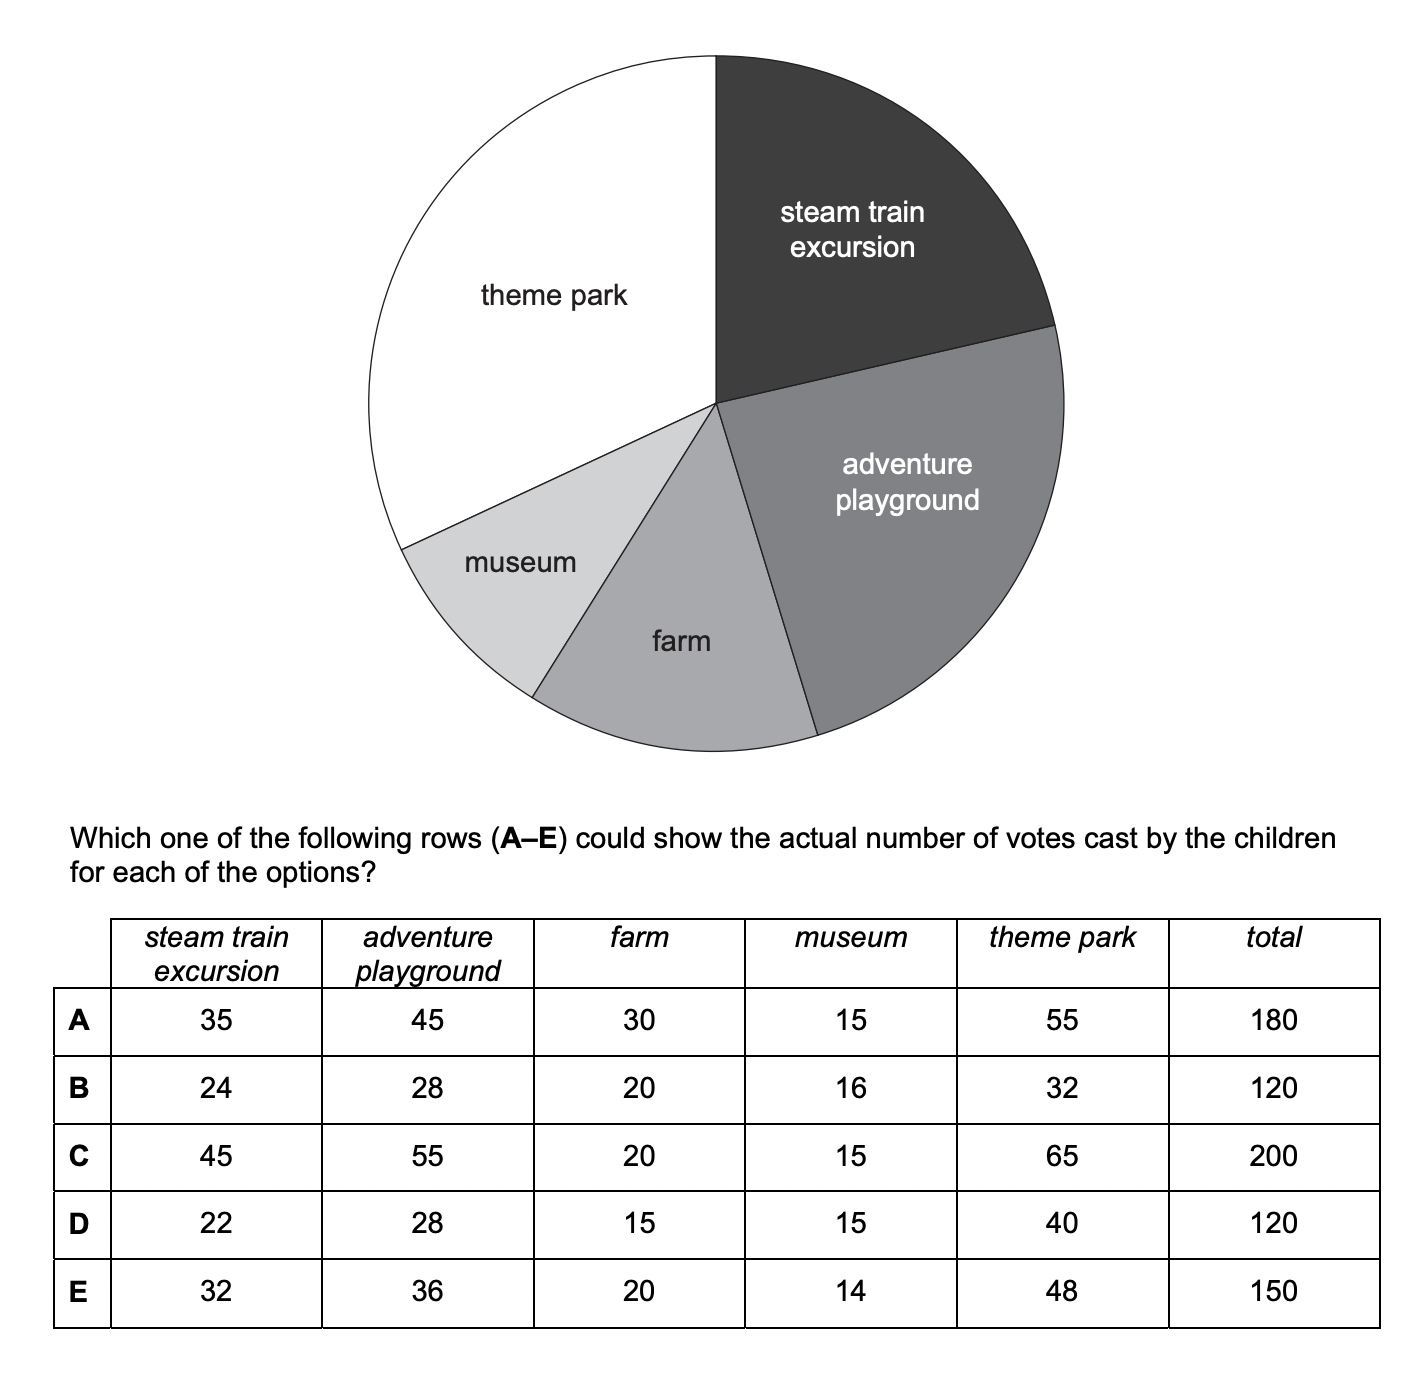
Which one of the following rows (A–E) could show the actual number of votes cast by the children for each of the options?