
TSA Original Paper 1 · Question 49 · Logic
SaveThe table below shows the average monthly rainfall for a town for each year from 2015 to 2030 along with a moving 5-year average (the value shown beside 2030 is the average from 2026 to 2030 inclusive). Three values are missing from the table.
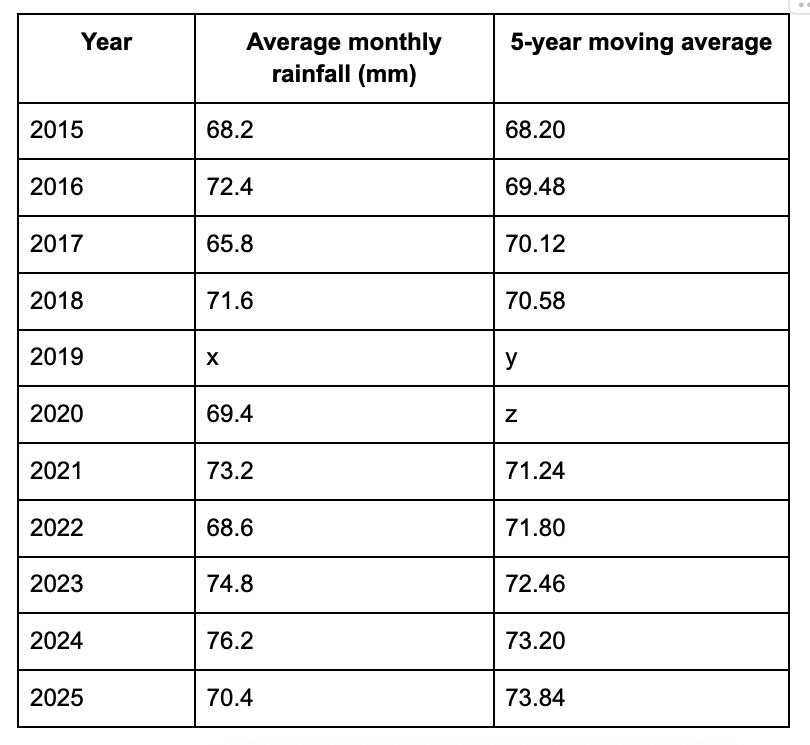
What value should be in the position marked 'y'?